The Wood Buffalo Environmental Association (WBEA) monitors the environment of the Regional Municipality of Wood Buffalo (RMWB) in north-eastern Alberta 24 hours per day, 365 days per year.
2020 was a year that required most people to make adjustments. Businesses specifically had to make huge changes to their operations, and the WBEA was no different. These changes were easy for some, and tougher for others to manage, especially considering isolation requirements. COVID-19 and its impacts on the province, country, and economy forced us all to rethink what works, and how we can continue to make progress. As the situation evolved, the WBEA was able to make moves to continually reduce the risk, while keeping critical monitoring activities going. As the WBEA demonstrated during the 2016 Horse River Wildfire, adaptability is part of how this organization and its people work. The WBEA had a strong COVID-19 pandemic response: created a mitigation plan, motioned to move all WBEA meetings to online platforms, and developed safety protocols for all field work conducted. While not knowing how long we would continue to be in a modified work mode, staff continued to demonstrate their ability to continue world class monitoring. The extent to which we are willing to be nimble, creative, and experimental will determine how successful we are coming out of the end of this. The WBEA's demonstrated ability to find ways to make the work happen safely is something that we know will continue. We express our appreciation to Sanjay for his leadership and all of the WBEA employees for being part of making this work.
The Governance Committee (GC) considered how the WBEA's strategic goal of being scientifically credible, along with its ability to deliver and report on high-quality monitoring programs and data, has helped secure funding for the WBEA’s monitoring programs. Additionally, sub-regional monitoring is ideal to engage communities and represent unique regional concerns and issues, and this is what is being advocated for when WBEA stakeholders and GC members attend Oil Sands Monitoring (OSM) Program committee meetings. We thank our Members for their commitment and advocacy, and the significant difference that this, and the WBEA's active membership, has made. This engagement is what makes the WBEA unique from other airsheds.
The WBEA began preparing for the 2022-2026 Strategic Plan process by putting together the Steering Committee, comprised of members from the WBEA’s General Members Board (GM) and Technical Committees. During the WBEA's last Strategic Planning sessions in 2016, we were working with a new provincial government, and we were trying to develop a better understanding of expectations on the role of environmental monitoring. We built a plan that assumed holding the course, and acknowledged that we would adapt if needed. As we enter another Strategic Planning cycle early next year, we are continuing to seek clarity. I believe that it's reasonable to hold the same approach this time. We are comfortable in both the "what" of the WBEA work scopes, and confident in the "how." As we move through the next year, we will continue to adapt as needed, and deliver the results that all of our members expect. Our best product will come with engagement and participation, and I would like to thank all of those who have stepped up to be part of the Strategic Planning team. I think this is another great example of the increased participation from our Members over the course of this year.
I would like to again thank the WBEA membership for your participation, and I look forward to another great year.
Cliff Dimm, WBEA President
Message from the Executive Director
The past year was full of challenges and opportunities for the WBEA, which were also experienced by people and organizations in the region and around the world. Our staff responded well, and through operational, business continuity, and COVID-19 mitigation planning, along with our collective ability to adapt to new and developing situations, the WBEA was able to maintain 90% of our operations throughout the height of the pandemic. Our focus was maintaining the safety of our staff, while we also wanted to ensure that the WBEA continued to provide leading air quality monitoring programs and data reporting.
The WBEA worked to implement best practices, developed business cases for sharing the WBEA Centre with Alberta Environment and Parks (AEP) and establishing the Analytical Services Group, and conducted a legal review of all WBEA contracts. These opportunities will bring operational improvements and sustainable cost savings to the WBEA. We were pleased to receive 100% compliance with the AEP’s audit of the WBEA’s ambient air monitoring network, and the WBEA was awarded a Gold Certificate of Excellence in Business by the Member of Parliament (MP) for the Fort McMurray- Cold Lake region.
To further develop a transparent relationship with AEP, the WBEA relayed concerns regarding operational impacts as a result of changes to or interpretations of the Air Monitoring Directive (AMD) and Alberta Energy Regulator (AER) amendments to Environmental Protection and Enhancement Act (EPEA) clauses. The WBEA also provided comments to AEP on the Draft Total Reduced Sulphur (TRS) Guideline and Ambient Air Quality Objective/Guideline (AAQO/G) clarifications.
In August, the WBEA was notified of the Oil Sands Monitoring (OSM) Program’s funding decisions for 2020/2021 work plans. From a dollar-value perspective, the WBEA received 97% of its requested funding for core monitoring programs. The budget demonstrated that the WBEA continues to reduce its costs and becomes more cost effective as an organization each year. The WBEA regularly submitted progress reports to the OSM Program to demonstrate the advancement and achievement of project deliverables.
There were a number of improvements made at the WBEA Centre and within our monitoring network. This included the completion of a leasehold improvement of our second-floor conference room. The boardroom was named in honor of Freddy Castor, a landowner who supported the WBEA and its placement of an air monitoring station in Fort Chipewyan.
The WBEA continued to participate in various air quality initiatives in the province, which included contributing to AEP’s State of the Environment Report, and being a representative for the Alberta Airshed Council (AAC) on the Clean Air Strategic Alliance (CASA) Air Quality NO2/SO2 subgroup for the Alberta Ambient Air Quality Objectives (AAAQOs) and the Canadian Ambient Air Quality Standards (CAAQS) Achievement project. The WBEA continually works with the AAC on developing key priorities for the Airsheds to align with government priorities and to engage Albertans on the importance of clean air.
I would like to thank the members of our Governance Committee and General Members Board for your continued guidance, support, and engagement over the past year. Your collective knowledge and expertise are invaluable to the Association. We look forward to working together to accomplish our common monitoring objectives to maintain an efficient monitoring organization in the Regional Municipality of Wood Buffalo to deliver high-quality environmental monitoring programs. I also want to acknowledge the dedication and support of WBEA staff and Science Advisors in working toward and delivering on our organizational goals.
Sanjay Prasad, WBEA Executive Director
Who is the WBEA?
Strategic Plan
The WBEA 2017-2021 Strategic Plan captures, in a single document, what the WBEA is about and what it seeks to achieve over the next five years. The plan focuses on four major goals:
Provide state-of-the-art environmental monitoring
Support meaningful stakeholder engagement and strategic partnerships
Recognize traditional knowledge as an important source of wisdom and information
Establish socially and fiscally responsible business practices
All of the WBEA's 40-member organizations contributed to the planning process. The development of the plan involved reflecting on past years of operation, gathering feedback and perspectives from all participants and setting goals to successfully carry the organization into the future.
Vision
People are empowered to make informed decisions to ensure a safe and healthy environment.
Mission
The WBEA is a multi-stakeholder, consensus-based organization that leads in state-of-the-art environmental monitoring to enable informed decision-making.
Core Values
We are scientifically independent.
We recognize, respect, and use traditional knowledge.
We are transparent and timely in communicating accurate and accessible data.
We are dedicated to using best available practices and technology.
We support diverse stakeholder participation to achieve consensus-based decisions.
Organizational Structure
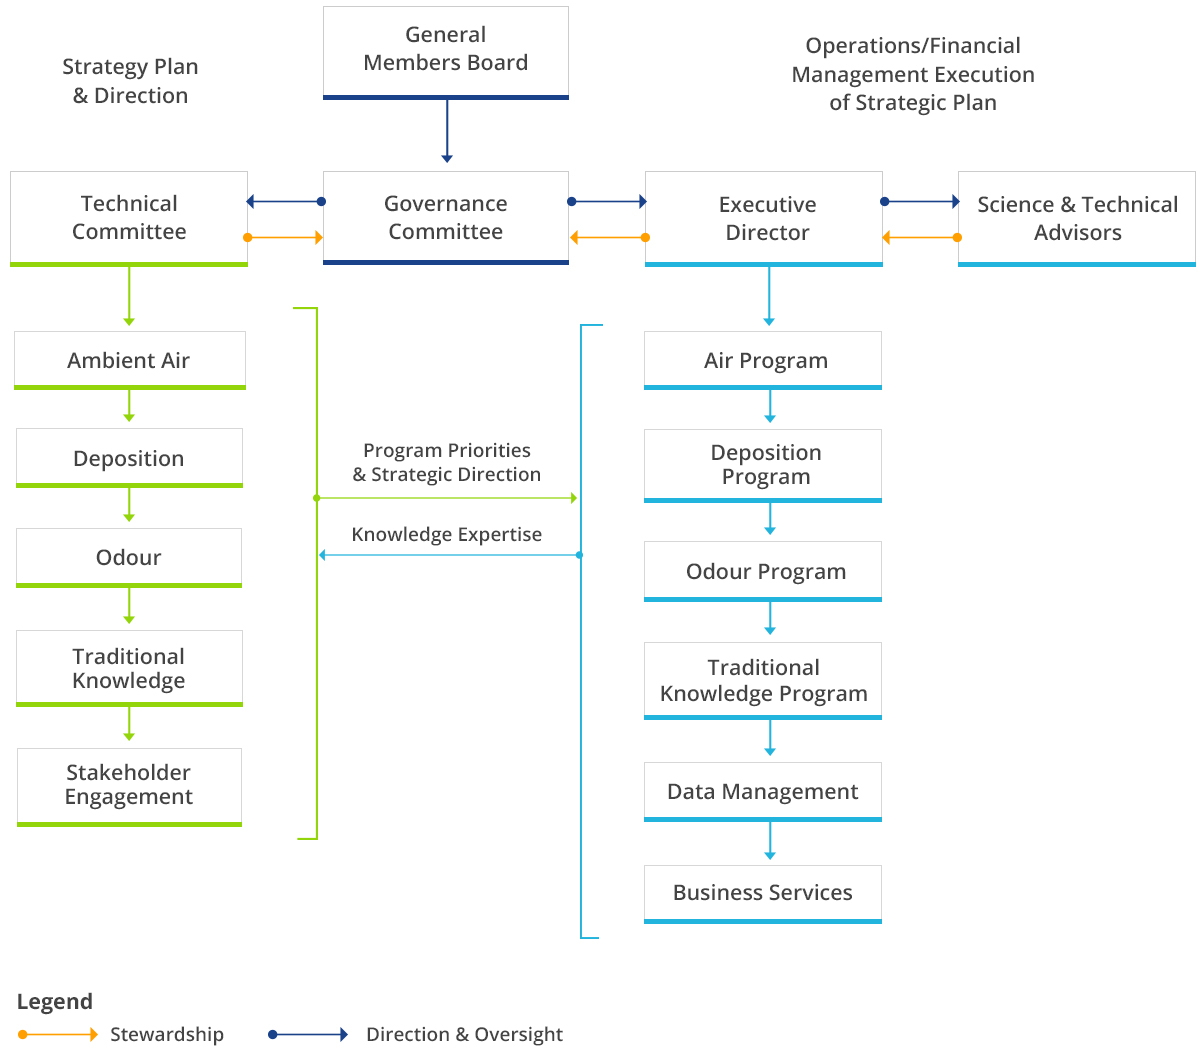
The diagram below depicts how the WBEA operates and shows the relationships between the General Members Board, Governance Committee, Technical Working Groups, and the WBEA staff. The General Members Board and Governance Committee provide strategic direction and oversight for the organization. The Technical Committees determine the strategic plans and direction for each of the WBEA's monitoring programs. The Executive Director provides operational direction for the WBEA staff, engaging science and technical advisors as required, to ensure stewardship to the overarching direction set by the General Members Board and Governance Committee.
Alberta Environment and Parks
Oil Sands Monitoring Branch
Alberta Environment and Parks (AEP) is responsible for monitoring, evaluating, and reporting on key air, water, land, and biodiversity indicators. The mandate within the ministry is to provide open and transparent access to scientific data and information on the condition of Alberta's environment, including specific indicators as well as cumulative effects, both provincially and in specific locations. The Oil Sands Monitoring (OSM) Program is a joint federal and provincial initiative between the Government of Alberta and Environment and Climate Change Canada. The mandate of the program is to implement an ambient environmental monitoring program in the oil sands region that integrates air, water, land, and biodiversity. The OSM Program strives to improve characterization of the state of the environment and enhance understanding of the cumulative effects of oil sands development.
The WBEA has entered into a contractual agreement with AEP. As a working partner, the WBEA is one of the agencies helping to ensure that the OSM Program is delivered with the best expertise possible.
The WBEA is a member of the Alberta Airsheds Council (AAC), which is a partnership of Alberta’s Airsheds and provides leadership in support of healthy air quality for Albertans and the environment.
Initiated in 2006, the AAC includes membership from all ten Airsheds in Alberta and was formed to represent the collective interests of this collaborative group.
The AAC provides a forum for Airsheds to work and learn together, to continue to advance effective and efficient air monitoring, reporting and outreach, and to address regional matters.
To view any of the Airshed's websites, click on a region in the map and then click on the link provided.
This map does not reflect the current Airshed boundaries that were updated in 2019. To see the updated boundaries, click here.
WBEA Monitoring Network
All Stations
WBEA Boundary
Continuous Sites
Forest Health Sites
Passive Sites
Meteorology Towers
Portable Ozone Monitor
Deposition Sites
Active Air Sites
This map shows the locations for all monitoring stations in 2020 within the WBEA monitoring network. For more information on these stations, please visit wbea.org/network-and-data/monitoring-stations.
Ambient Air Monitoring
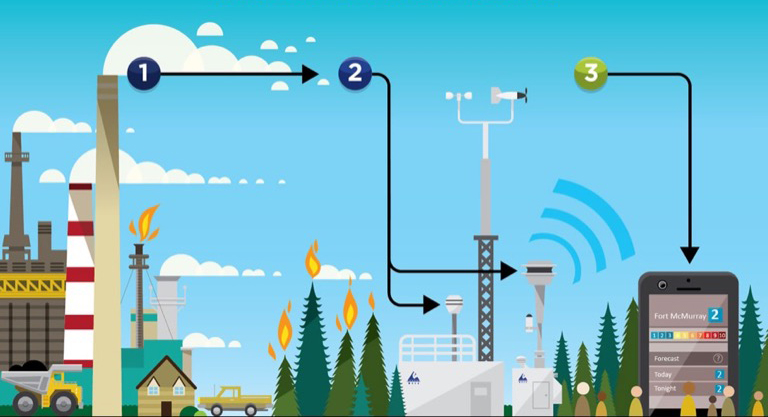
The WBEA operated 29 ambient air monitoring stations in 2020 throughout the RMWB. These included industrial, attribution, community, background, and meteorological stations. The image below demonstrates how the WBEA collects ambient air data through continuous analyzers and time-integrated samplers to ensure residents and stakeholders have the information they need to make informed environmental decisions.
The WBEA provides all air monitoring data online via the following ways:
All WBEA air monitoring data are fully quality-assured and then sent by the end of the following month to airdata.alberta.ca, an AEP on-line database for all of Alberta's ambient air quality data.
All of the WBEA's data can also be found on our website at wbea.org.
Pollution is emitted into the air from a variety of sources
Measure
The WBEA ambient air monitoring stations measures the concentrations of pollutants in the air
Share
The information the WBEA collects is available to view on wbea.org and is used to calculate the air quality health index (AQHI)
Air Quality Health Index
The Air Quality Health Index, or AQHI, is a provincial scale designed to help people understand what air quality means to their health. It is a tool designed to help individuals make decisions to protect their health by limiting short-term exposure to air pollution and adjusting activity levels during increased levels of air pollution.
The AQHI includes concentrations of nitrogen dioxide (NO2), fine particulate matter (PM2.5), and ground-level ozone (O3), which are three compounds that can cause respiratory effects. Additionally, in Alberta, hourly pollutant concentrations are compared against Alberta's Ambient Air Quality Objectives (AAAQOs). If an AAAQO is exceeded, the AQHI value is overridden with a HIGH or VERY HIGH risk value. However, odour causing compounds measured in the WBEA network are not considered in the AQHI. Therefore, this index gives an idea of air quality based on some pollutants, but it does not describe the potential for odour events.
The community of Fort McKay has also developed its own Fort McKay Air Quality Index (FMAQI), based on the data collected by the WBEA at its Bertha Ganter-Fort McKay air monitoring station. The FMAQI is independent of the provincial AQHI, and includes compounds that can indicate odours, such as Total Reduced Sulphur (TRS), total hydrocarbons (THC), and sulphur dioxide (SO2). For more information on the FMAQI, visit: wbea.org/air/fort-mckay-air-quality-index-aqi/.
The World Health Organization (WHO) Air Quality Guidelines offer guidance on threshold limits for key air pollutants that pose health risks and provide a reference for setting air pollution targets at regional and national levels to improve air quality. The WHO provides additional details in their guideline publication.
The table below provides a summary of the WHO Air Quality Guidelines.
Parameter
Averaging Period
Objective or Guideline Value
Units
Fine Particulate Matter (PM2.5)
24-hour 99th percentile
25
µg/m3
Annual
10
µg/m3
Nitrogen Dioxide (NO2)
1-hour
105
ppb
Annual
21
ppb
Ozone (O3)
8-hour daily maximum
100
ppb
Sulphur Dioxide (SO2)
24-hour
48
ppb
Annual
20
ppb
Canadian Ambient Air Quality Standards
The Canadian Ambient Air Quality Standards (CAAQS) are national air quality standards that are designed to protect human health and the environment. The CAAQS inform the development of management plans and appropriate management actions required to improve air quality. The CAAQS, which are based on three years of data, are targeted to assess air quality issues that can be controlled locally through management actions (such as emissions reductions). The Government of Alberta provides additional information about CAAQS on their website.
The table below provides a summary of the CAAQS for 2020 and 2025.
Contaminant
Average Time
Numerical Value Effective
Statistical Form of the Standard (Metric)
2020
2025
NO2 (ppb)
Annual
17
12
Arithmetic average over a single calendar year of all NO2 1-hour average concentrations in the year
1-hour
60
42
3-year average of the annual 98th percentile of the NO2 daily maximum 1-hour average concentrations
SO2 (ppb)
Annual
5
4
Arithmetic average over a single calendar year of all SO2 1-hour average concentrations in the year
1-hour
70
65
3-year average of the annual 99th percentile of the SO2 daily maximum 1-hour average concentrations
O3 (ppb)
8-hour
62
60
3-year average of the annual 4th highest of the daily maximum 8-hour average ozone concentrations
PM2.5 (µg/m3)
Annual
10
8.8
3-year average of the annual average of all 1-hour concentrations
24-hour
28
27
3-year average of the annual 98th percentile of the daily 24-hour average concentrations
Alberta Ambient Air Quality Objectives & Guidelines
Alberta's Ambient Air Quality Objectives (AAAQOs) and Ambient Air Quality Guidelines (AAAQGs) were developed under the Alberta Environmental Protection and Enhancement Act (EPEA) to protect Alberta's air quality. AAAQOs help assess industry compliance and evaluate facility performance, and AAAQGs are a general performance indicator used to help with airshed planning and management. Both are established for a variety of averaging periods depending on the characteristics of the pollutant.
The first graph below presents a total count of air quality event exceedances at all WBEA ambient air monitoring stations over a five-year period for AAAQOs from 2016-2020. Since the PM2.5 1-hour AAAQG was established in 2019, exceedance data available from 2019 and 2020 are included in the graph. The second graph shows the exceedances for 2020 based on station locations.
Note: Forest fire season was considered to be from March 1 – October 31, 2020. There were no PM2.5 AAAQO exceedances in 2020; however, there were 14 PM2.5 AAAQG exceedances outside the forest fire season.
Note: The WBEA began reporting PM2.5 AAAQG exceedances in 2019 as per the Alberta Air Monitoring Directive (AMD) requirements; the graph shows exceedance data for only 2019 and 2020.
Reporting Air Quality Events
When ambient concentrations of any air pollutant that the WBEA measures exceed the AAAQO, the WBEA has an Immediate Reporting Protocol that is put into action:
1. The data collection system automatically sends out alarm notifications to the WBEA personnel and an independent third-party alarm monitoring company.
2. The alarm company acknowledges the incoming alarm and reports the data and supporting information such as wind conditions, locations, time, etc., to AEP in real time, or as soon as becoming aware of it. AEP uses the data and information from the WBEA to follow-up as appropriate.
3. If the exceedance occurs at an industry station, the owner is informed that they have exceeded an AAAQO, and provided with the same information that was given to AEP. They are then required to follow up with AEP and/or the Alberta Energy Regulator (AER) and submit a report within seven days of the exceedance.
The AAAQGs are not intended for compliance monitoring and the Air Monitoring Directive clarifies that 24-7 or “on-call” reporting by Alberta airsheds is not required. The WBEA reports exceedances during business hours and does not use a third-party alarm contractor. The WBEA notifies stakeholders and partners of the exceedance via email.
The table below shows the objectives and guidelines for the parameters which have established AAAQOs and AAAQGs within the WBEA monitoring network. Where there is a dash (-) in the table below AAAQOs or AAAQGs do not currently exist.
Parameter
1-hour Average
8-hour Average
24-hour Average
30-day Average
Annual Average
AAAQO
Sulphur Dioxide (SO2)
172 ppb
-
48 ppb
11 ppb
8 ppb
Nitrogen Dioxide (NO2)
159 ppb
-
-
-
24 ppb
Ozone (O3)
76 ppb
-
-
-
-
Total Reduced Sulphurs (TRS) / Hydrogen Sulphide (H2S)*
10 ppb
-
3 ppb
-
-
Particulate Matter 2.5 (PM2.5)
-
-
29 μg/m3
-
-
Carbon Monoxide (CO)
13 ppm
5 ppm
-
-
-
Ammonia (NH3)
2 ppm
-
-
-
-
AAAQG
PM2.5
80 μg/m3
-
-
-
-
*In the WBEA network TRS concentrations are reported using the H2S AAAQOs.
WBEA's Air Quality Events (AQE) App
The WBEA created an Air Quality Events (AQE) app to provide near real-time information about air quality events that occur in the network to its stakeholders and partners. The AQE app is available for download on Android and Apple platforms, and the AQE app stores historical and near real-time air quality events information on the WBEA AQE webpage.
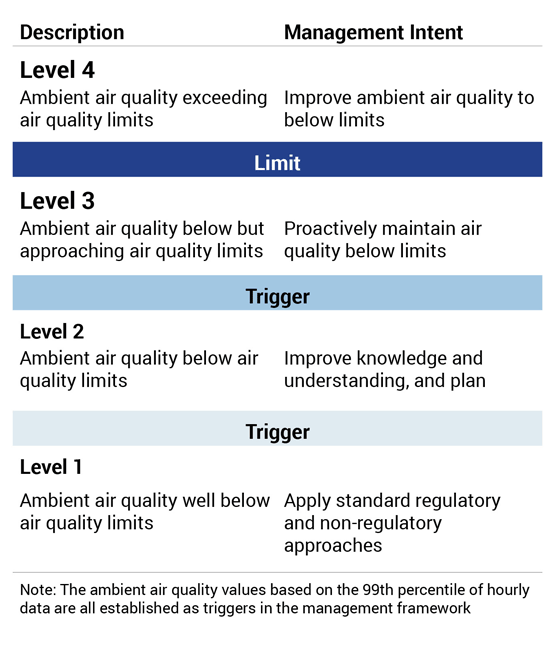
The Lower Athabasca Regional Plan (LARP) came into effect in September 2012 and was the first regional plan developed under the Alberta Land-Use Framework.
The LARP air quality objective is to manage releases from multiple sources so they do not collectively result in unacceptable air quality. LARP sets out trigger levels and limits for NO2 and SO2 as described in the table on the right. When a trigger is exceeded, AEP is required to create a regional management response.
The WBEA provides AEP with the air quality data that is used to calculate the annual LARP triggers and limits.
The graphs below show the annual average and hourly 99th percentile concentrations of NO2 and SO2 at each station location compared to the respective triggers and limit for each parameter. The use of the hourly 99th percentile data is a statistical measure to indicate upper limits of the data. Increases in the 99th percentile beyond the LARP triggers can be an early warning to help inform appropriate management actions to prevent future exceedances.
Note: * Parameter not measured at station. Note: ** Stations operational less than 75% of the time in 2020.
Regional Wind Profiles
Air pollution transport, dispersion, transformation, and deposition are influenced by meteorological parameters, such as wind speed, wind direction, the vertical temperature structure of the atmosphere, humidity, atmospheric pressure, precipitation, and solar radiation.
The wind rose plots provided show the direction, speed, and frequency of winds at each community station in the network in 2020. The legend for the wind speed is shown below. The colours within each wind rose triangle denote the frequency of the wind speed. Calms are shown for each community as a percentage of time that wind speeds are below 0.5 km/h.
For example, the largest triangle in Fort Chipewyan wind rose shows the wind comes from the east, just 18% of the time in 2020. The yellow colour in this triangle shows the wind was between 20 and 25 kilometers per hour (km/h) 4% of the time. Wind speeds were less than 0.5 km/h in Fort Chipewyan 0.13% of the time (calms).
The WBEA's ambient air quality monitoring program is conducted through both continuous and time-integrated (non-continuous) sampling methods. The following graphs provide general information for each parameter measured and the corresponding data collected for 2020.
Continuous ambient air monitoring uses analyzers that constantly measure the concentrations of different pollutants in the air. All stations also continuously measure temperature, relative humidity, and wind speed and direction. The WBEA's continuous sampling data is available to everyone at wbea.org/network-and-data/historical-monitoring-data. The data for continuous monitoring is presented in the graphs below as the annual hourly average (mean) concentrations of each parameter, along with the annual hourly 99th percentile and maximum concentrations. The annual hourly 99th percentile is used to show the high end of concentrations measured at the WBEA air monitoring stations, after removing the highest 1% of events which may be outliers.
Note: Averages may be too small to be visible on some graphs. Hover over the graph to view specific values.
Sulphur Dioxide (SO2)
Nitrogen Dioxide (NO2)
Ozone (O3)
Carbon Monoxide (CO)
Carbon Dioxide (CO2)
Total Reduced Sulphurs/Hydrogen Sulphide (TRS/H2S)
Total Hydrocarbons (THC)
Non-Methane Hydrocarbons (NMHC)
Fine Particulate Matter (PM2.5)
Ammonia (NH3)
Note: **Stations operational less than 75% of the time in 2020.
Note: Averages may be too small to be visible on some graphs. Hover over the graph to view specific values.
Sulphur dioxide (SO2) – Sulphur dioxide is produced from the combustion of sulphur-containing fossil fuels. Sulphur dioxide in the air at high concentrations can make breathing difficult, particularly for children, the elderly, and people with asthma. Sulphur dioxide reacts in the atmosphere to form sulphuric acid and acidic aerosols, which contribute to acid deposition and acid rain.
Time-integrated sampling provides more detailed analysis of species present in ambient air, and supplements continuous monitoring which reports a total concentration in real-time. Time-integrated monitoring methods consist of exposing sample media to the atmosphere for a period of time, and then the media is sent to a laboratory for analysis.
The WBEA's time-integrated sampling data is available to everyone at wbea.org/network-and-data/integrated-data. The data for time-integrated monitoring methods is presented in the graphs below as the annual average (mean) of 24-hour sample concentrations, along with the 95th percentile to show readings on the high-end of the data collected, after removing the highest 5% which may be outliers. There are numerous species collected, however, the graphs show the 10 parameters with the highest concentrations in 2020.
Note: Select which parameter you would like to view, and then use the drop-down menu to select an air monitoring station.
Note: Averages may be too small to be visible on some graphs. Hover over the graph to view specific values.
Particulate Matter 2.5 (PM2.5) Ions
Particulate Matter 2.5 (PM2.5) Metals
Particulate Matter 10 (PM10) Ions
Particulate Matter 10 (PM10) Metals
Polycyclic Aromatic Hydrocarbons (PAHs)
Volatile Organic Compounds (VOCs)
Change the location
PM2.5 refers to particles in the fine fraction (2.5 µm in diameter or less) that are produced mainly by combustion processes and by atmospheric reactions between precursor gases such as sulphur dioxide, nitrogen oxides, ammonia and some volatile organic compounds. In the coarse fraction (between 2.5 and 10 µm in diameter), particles are mainly from re-suspended road dust, windblown dust, and material handling, grinding and crushing operations. PM10 includes both the fine and coarse fractions and is sometimes referred to as inhalable particulate matter. Particulate matter consists of a mixture of solid particles and liquid droplets found in the air. Fine particulate matter (PM2.5) is 2.5µm in diameter or less, while coarse particulate matter (PM10) is 10µm in diameter or less.
In the time-integrated sampling program, particulate matter (both PM2.5 & PM10) is collected on a filter for a 24-hour period, every six days. PM2.5 samples were collected at six community stations (Bertha Ganter-Fort McKay, Patricia McInnes, Athabasca Valley, Anzac, Janvier, and Conklin) and one industrial location (Horizon). PM10 samples were taken at the same six community stations and three industrial stations (Fort McKay South, Horizon, and Muskeg River). These filters are then sent to the lab for sample analysis to learn the chemical compositions including ionic and metal species. Ions are electrically-charged, water-soluble particles, while metals are neutral species.
The continuous analyzer can tell us the concentration of particulate matter in the air at any given time, while a time-integrated sample can tell us what is making up the composition of the particulate matter in the air.
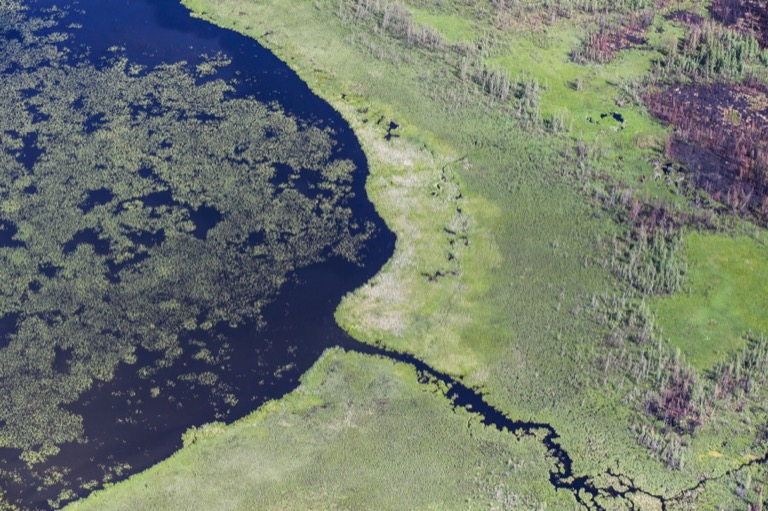
The Deposition Monitoring program, also referred to as the Terrestrial Environmental Effects Monitoring (TEEM) program, was established to address community, industry, and government concerns about impacts to regional forests resulting from industrial development.
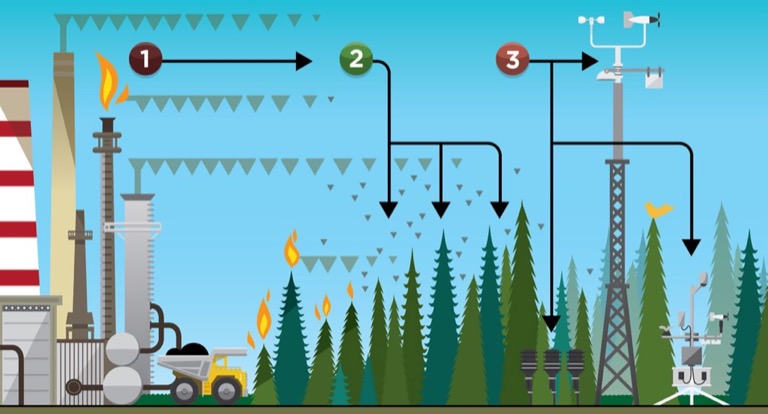
The objective of the program is to determine cause-effect relationships between air pollutants and forest ecosystem health in the region. To meet this objective the WBEA operates both a long-term Forest Health Monitoring Program and an Atmospheric Pollutant Deposition Monitoring Program which monitor stressors (acidification/eutrophication) along the pathway (atmospheric transport) from source (industrial emissions) to the receiving environment (jack pine forests). This integrated program, as depicted in the image below, allows for the determination of cause-effect relationships between air pollution and forest health.
Source
Pollution is emitted into the air from a variety of sources
Deposit
The pollution may be deposited onto the surrounding forest
Measure
The WBEA collects samples and information to measure the effects of pollution on the enviroment
Forest Health Monitoring
The Forest Health Monitoring program monitors jack pine forest sites to assess whether there are changes to biological, physical, and chemical indicators through a sampling campaign of soils and vegetation every 6-years, as well as lichen sampling at varying intervals. During initial program development, the upland jack pine (Pinus banksiana) ecosystem was identified as the most sensitive receptor to acidification due to their characteristically dry, nutrient poor soils with limited buffering capacity. In these ecosystems, the effects of acid deposition are expected to be observed in a cascading manner from soils to vegetation, first impacting individual organisms, then the stand, and onward to landscape level impacts. This concept is depicted in the graph below.
In 2019, the WBEA completed the analysis of historical data collected through the Forest Health and Deposition monitoring programs, in combination with data collected by the Ambient Air Monitoring program, and published nine open access manuscripts in a Virtual Special Issue of the journal Science of the Total Environment.
The special issue, entitled “Relationships Between Air Pollutants and Forest Ecosystem Health in the Oil Sands Region, AB, Canada” is available online, click here. To access key messages from the manuscripts or view the June 18, 2019 public presentation, click here.
In 2020, an additional report was finalized using data derived from the WBEA’s fourth intensive forest health sampling campaign in 2018, which included soil and needle sample collection, tree core collection, and documentation of various jack pine and forest stand characteristics. The report, which is intended to be published, supplemented the 2019 data analysis, presenting findings that continued to broaden the understanding of impacts to regional forests resulting from industrial development.
Atmospheric Pollutant Deposition Monitoring
To better understand the nature and quantity of the compounds deposited on the regional landscape, and to inform the Forest Health Monitoring program, the WBEA operates a network of air quality monitoring (using passive and active air quality samplers) and deposition monitoring sites (using ion exchange resins) in remote locations across the RMWB for evaluation of a broad set of compounds (particulate matter, organic compounds, metals). The WBEA's deposition monitoring data is available to everyone at wbea.org/network-and-data/integrated-data, and is searchable using the WBEA's Time-Integrated Data Search tool. For a list of the parameters measured at deposition monitoring sites, click here.
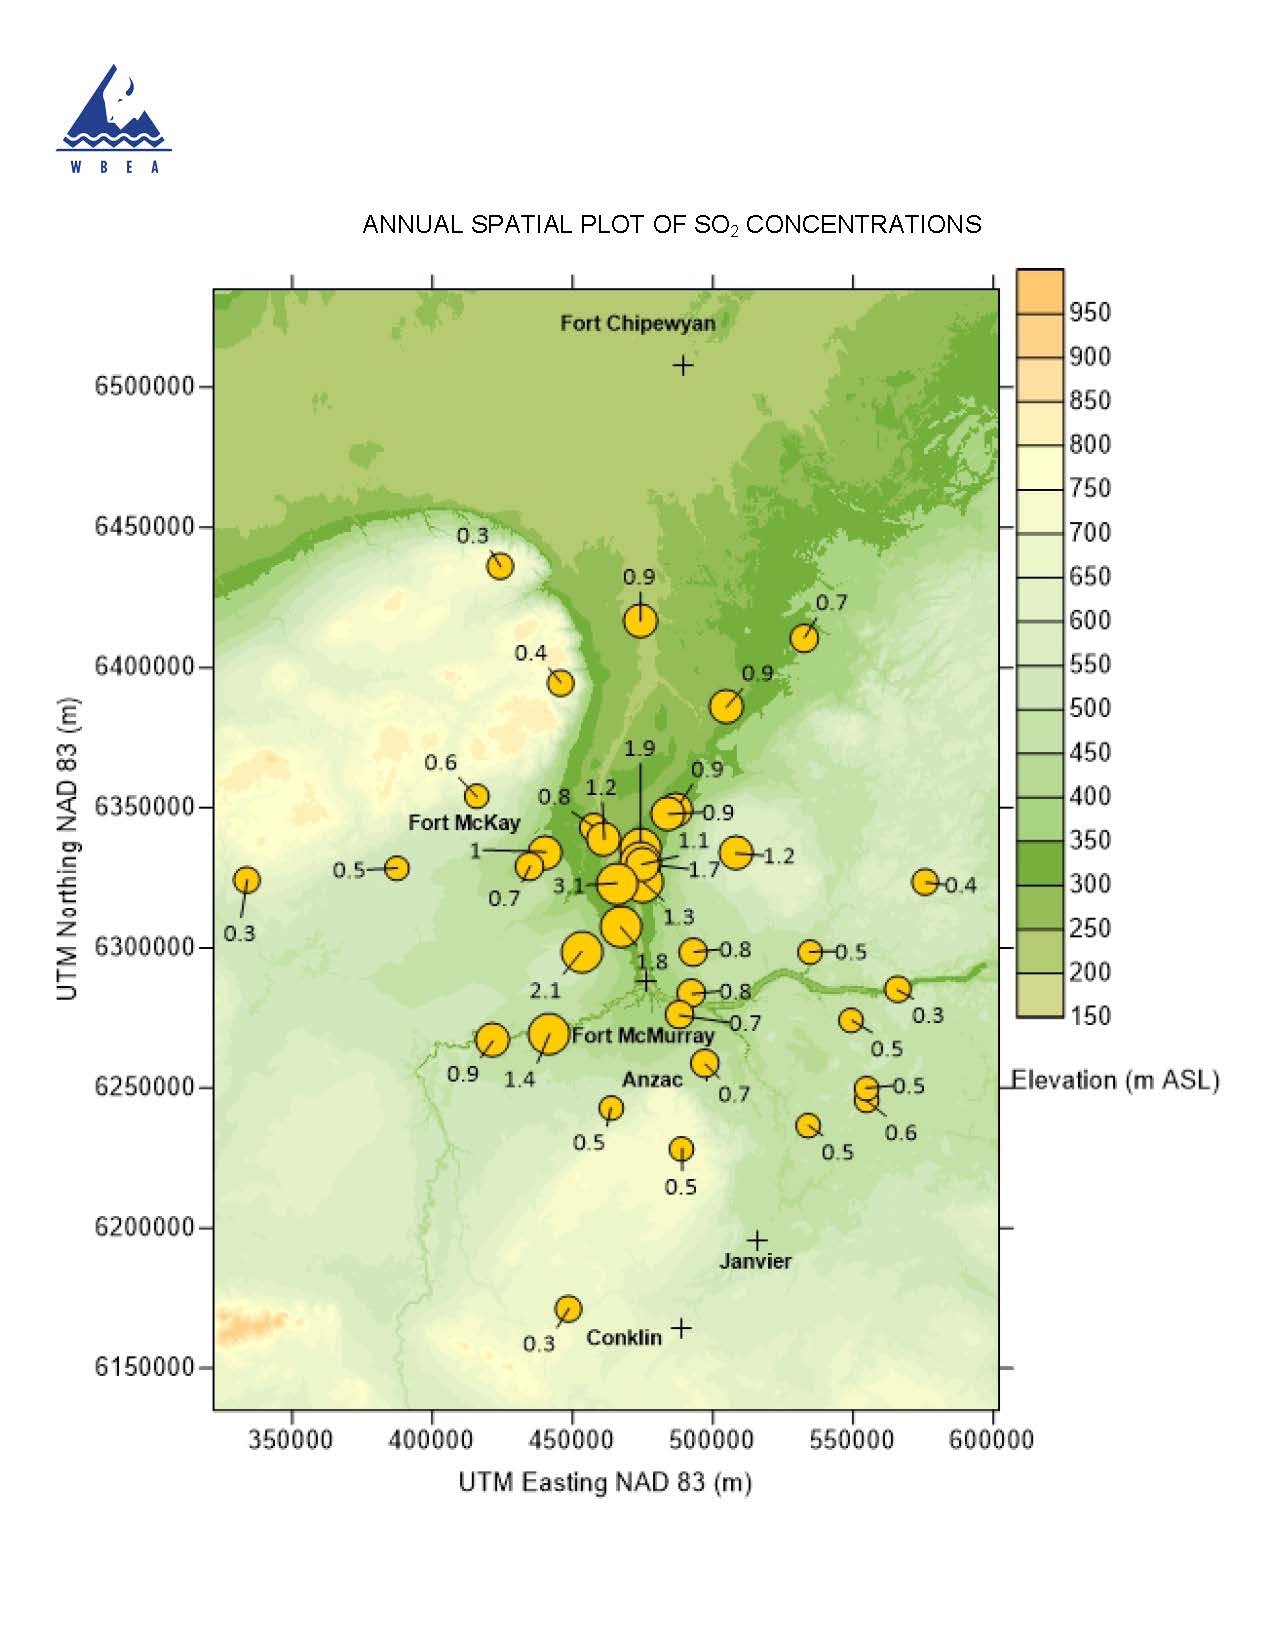
Passive Air Sampling - Passive Samplers
Passive air sampling, specifically using passive samplers, is a cost-effective method for coverage of a broad spatial range, including remote locations, because they have no moving parts and require no power. The WBEA uses passive samplers to monitor sulphur dioxide (SO2), nitrogen dioxide (NO2), nitric acid (HNO3), ammonia (NH3), and ozone (O3) across the Athabasca Oil Sands Region and this data, along with meteorological data, is used to model deposition trends. Data collected in 2020 is presented on the concentration maps at the link below; the bigger the circle the larger the concentration.
Active Air Sampling – Denuders and Remote Ozone Analyzers
Active air sampling uses a pump to provide a known volume of air to a continuous analyzer or sample media. For this reason, in addition to a low detection limit, active air sampling provides higher quality data than passive air sampling, however, because they require power, they can be more costly and less versatile. Ammonia (NH3), nitric acid (HNO3), and particulate matter (PM2.5) are monitored year-round by active sampling using a solar-powered denuder system. Ground-level ozone (O3) has been monitored seasonally with solar-powered continuous analyzers; however, the O3 program was paused for 2020. The WBEA's active air sampling data is available to everyone at wbea.org/network-and-data/integrated-data.
Passive Deposition Sampling - Ion Exchange Resin
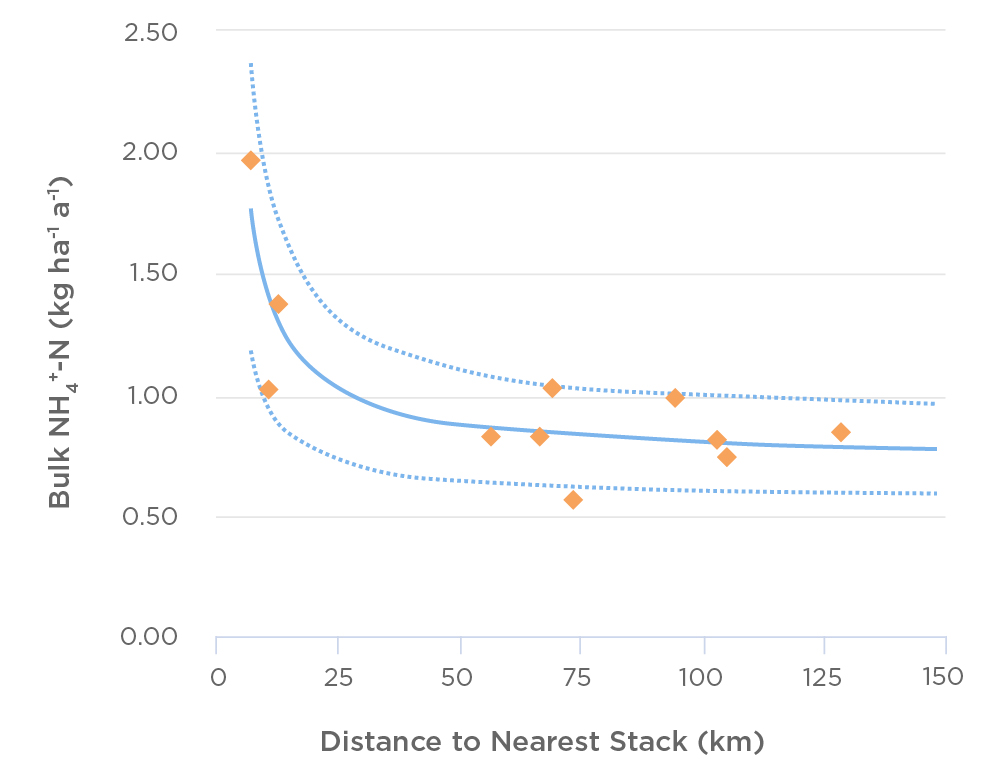
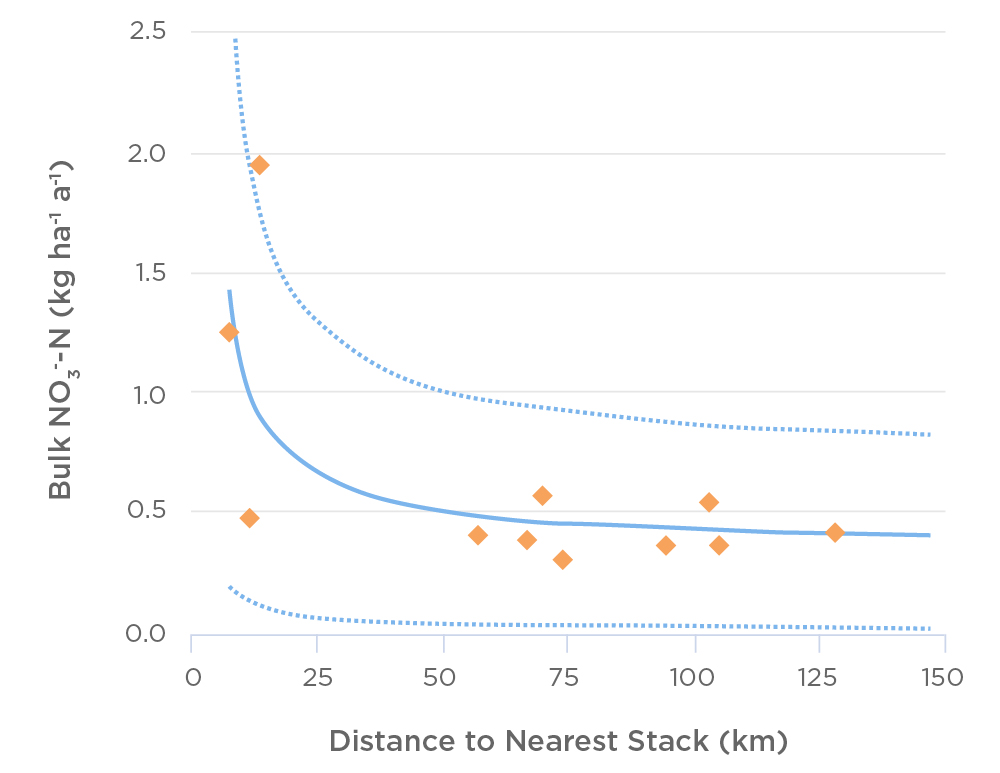
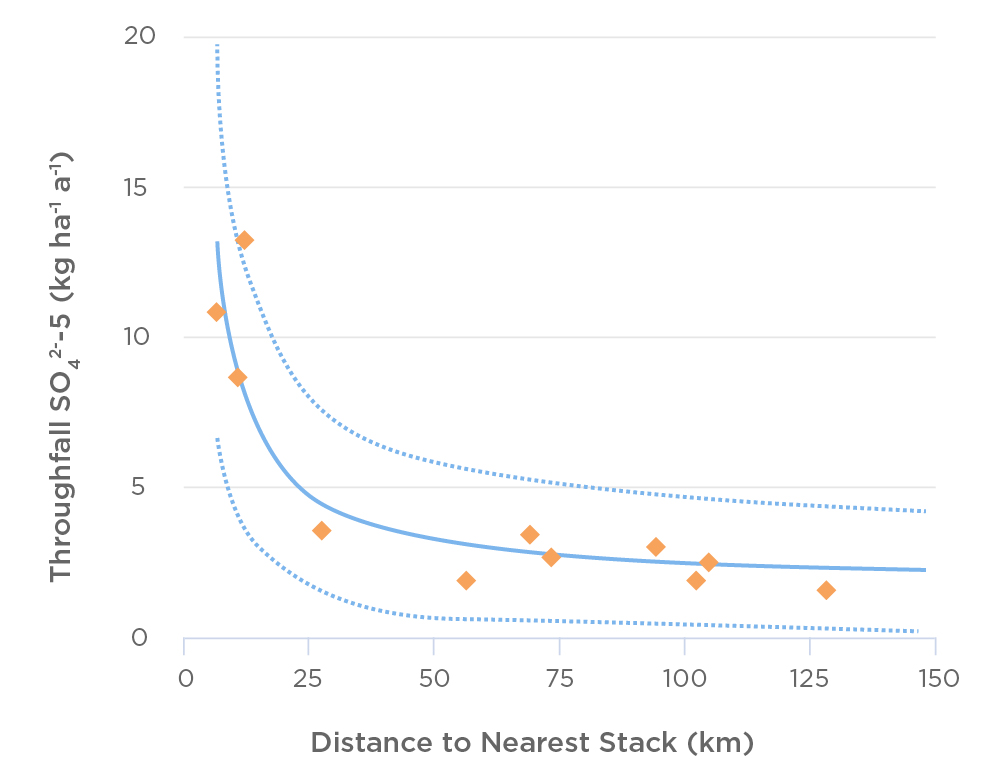
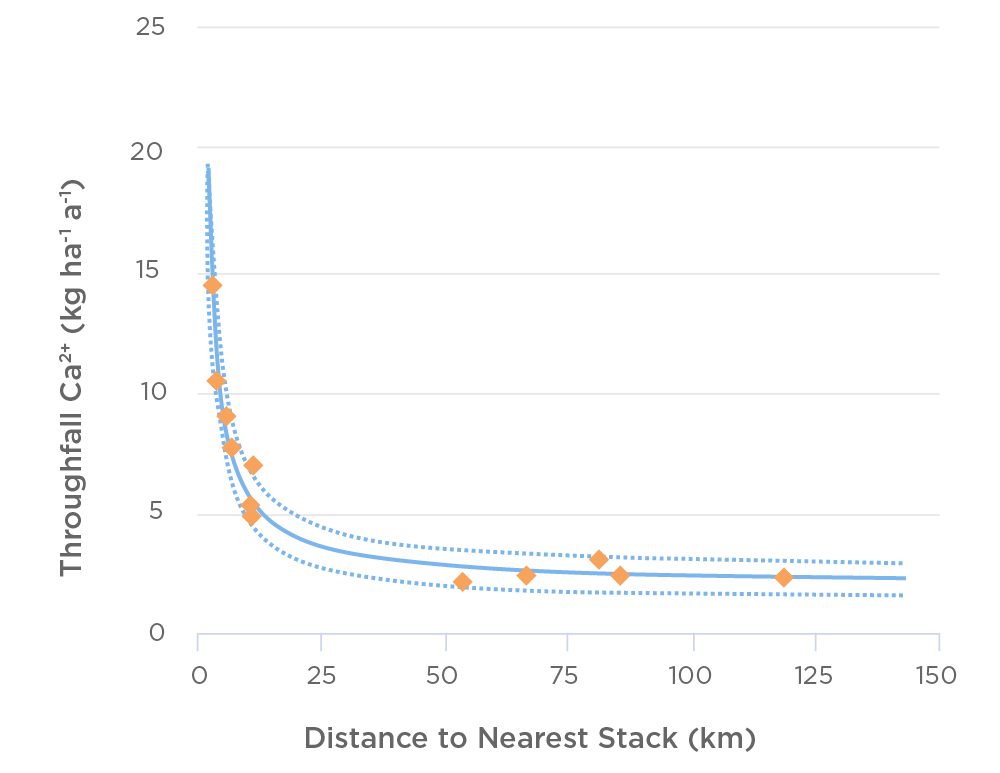
Ion exchange resin technology (IER) are a passive sampling technology, comprised of a column of resin beads that capture charged chemical species (ions) in precipitation water. IERs are critical to the deposition program as they provide actual measurements of deposition which are required to validate the critical loads mapping and modeling exercises. Using the WBEA’s most recent quality assured IER data, the graphs below depict the deposition of ammonium (NH4+), nitrate (NO3-), sulphate (SO42-), and calcium (Ca+) in relation to distance from the nearest emission source (stack) and indicates that deposition is higher close to emission sources.
Bulk ammonium, as nitrogen
Bulk nitrate, as nitrogen
Throughfall sulphate, as sulphur
Throughfall calcium
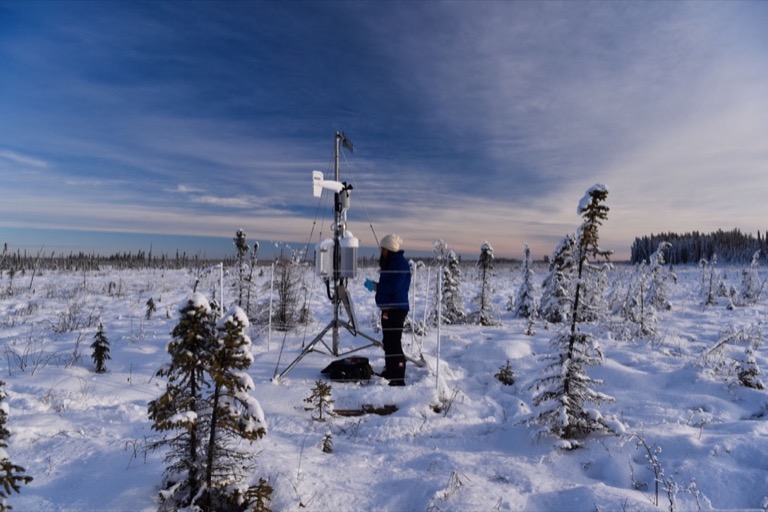
Instrumented Regional Meteorological Network
The WBEA's regional meteorological network provides key data for calculating deposition rates and evaluating ecological data. The network is comprised of six 30-meter instrumented towers ("met towers") and six instrumented tripods ("met tripods") that provide continuous, hourly data on climatic conditions throughout the Wood Buffalo region. Each met tower is co-located with a Forest Health Monitoring (FHM) site and monitors air temperature, relative humidity, wind speed, wind direction, and solar radiation at four levels within and above the jack pine canopy, as well as temperature and volumetric water content within forest soil. Each met tripod is positioned in natural peatland clearing adjacent to a FHM site and monitors air temperature, relative humidity, wind speed, wind direction, and solar radiation.
The map above shows where each of the six 30-meter meteorological towers are located within the WBEA's network. The wind data collected from these towers, measured above the tree canopy, are used to characterize wind flow in a wider geographical area, calculate emission deposition, and evaluate ecological data. The corresponding wind roses for each tower are located below.
WIND SPEED (km/h)
0.5 - 5
5 - 10
10 - 15
15 - 20
20 - 25
>= 25
Meteorological Tower 1004
Meteorological Tower 1007
Meteorological Tower 2001
Meteorological Tower 2013
Meteorological Tower 3011
Meteorological Tower 3016
Traditional Knowledge
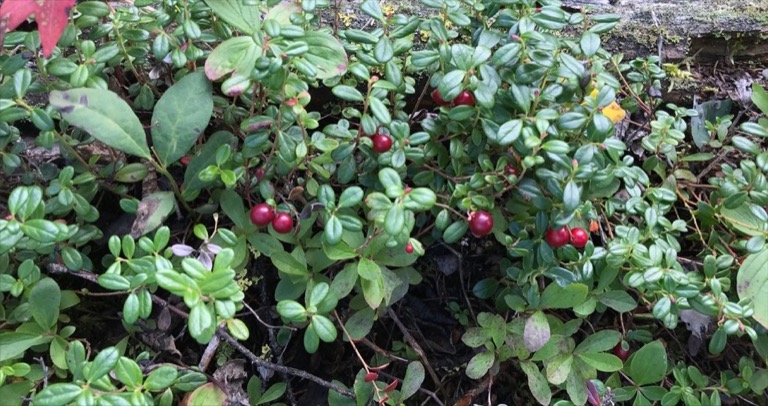
The WBEA has fostered collaborative relationships with Indigenous communities in the Wood Buffalo region since its formation. To coordinate these partnerships, the WBEA established a Traditional Knowledge Committee (TKC) to help develop and oversee long-term, traditional knowledge based, community monitoring programs; the recent focus has been on the Community-Led Berry Contamination Study.
The Community Led Berry Contamination Study is a multi-year community-based monitoring project that builds upon work initiated by Fort McKay First Nation, with support from the Wood Buffalo Environmental Association, since 2010. The project has grown to include Conklin Métis, Fort McKay Métis, Fort McMurray Métis, and Fort McMurray First Nation 468.
The study objective is to monitor berries from culturally significant patches to inform the community questions, including “are the berries safe to eat?” and is driven by the concerns of the participating community members about changes to berry quality and health due to oil sands-related development. The cultural identity of Indigenous peoples is intertwined with their food sovereignty and food security, therefore, the continued access to cultural keystone species of berries is paramount for community health and well-being.
Monitoring is achieved when participants visit each berry patch to spend time on the land, share lived experience and knowledge, observe environmental condition, harvest berries for laboratory analysis of health compounds and contaminants, and in previous years, collect soil samples for laboratory analysis of contaminants.
The study has produced qualitative and quantitative data for each community that has provided meaningful insight on their berry condition. While the WBEA provides support to the communities, the WBEA does not share the data on the communities’ behalf; however, there is some indication from this project that levels of contaminants of concern are elevated in berries from patches considered unclean by Indigenous members, which are located closer to oil sands development, versus berries from patches considered clean or sacred by Indigenous members, which are located farther away from development.
Going forward, the study will continue to use best practice methodologies that appropriately braid Indigenous and Western knowledge systems to build trusted relationships between participating Indigenous communities, academic researchers, and provincial and federal government scientists.
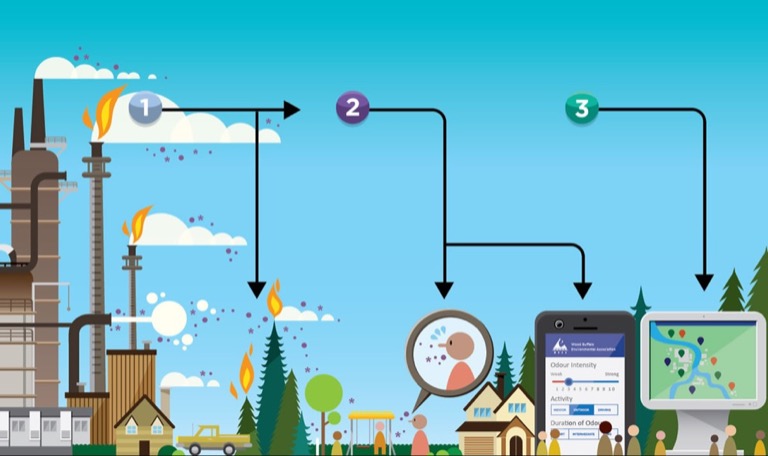
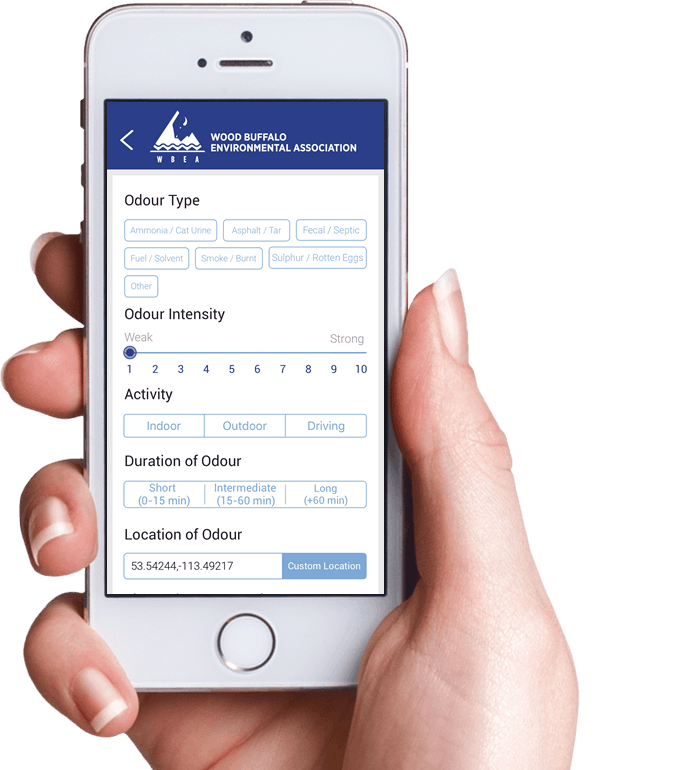
The WBEA created the Community Odour Monitoring Program (COMP) app as an opportunity for people to provide information about the odours they experience throughout the RMWB, as outlined in the image below. Currently, analyzers can measure the concentration of specific pollutants or groups of pollutants, but they cannot measure if an odour is present or how strong the odour would be. Therefore, the app allows the WBEA to compare the information people provide about odours to the ambient air data collected at WBEA air monitoring stations. The intent is to find whether there are trends in the ambient data when odours are present—such as elevated concentrations of odour-causing compounds. Observations are displayed in near-real time on the COMP website.
From the COMP app's release in September 2017 until December 2020, there have been a total of 1020 odour observations reported in the RMWB using the app. In 2017-2018 there were 376 odour observations, while in 2019 and 2020, there were 415 and 229 odour observation submissions, respectively. In 2020, the WBEA received odour observations from 55 unique users, and in 2018 and 2019 received observations from 95 unique users. The dominant odour type for 2020 and 2019 was 'Ammonia/Cat Urine', whereas for 2018 was 'Asphalt/Tar'. The fraction of odour observations characterized as being of high intensity*, have been steadily increasing over the past three years.
Learn more about the COMP and the 2020 COMP Annual Report on the COMP website.
* Scale of 1 to 10, with 10 being the highest intensity
Pollution is emitted into the air from a variety of sources
Smell
The pollution may cause odours - anyone who experiences an odour in the RMWB can submit their observations via the WBEA’s COMP app
Share
Users can learn about odours and view all observations submitted at comp.wbea.org
Comp needs YOU!
The Community Odour Monitoring Program is still going on. To participate and provide information on the odours you experience in the Regional Municipality of Wood Buffalo:
1
Download the COMP App for iPhone or for Android devices
2
When you smell an odour in the air, submit an observation in the App
The information collected is anonymous and will be used for research purposes only.
WBEA 2020 Membership
INDIGENOUS MEMBERS
Athabasca Chipewyan First Nation
Chipewyan Prairie Dene First Nation
Christina River Dene Nation Council
Conklin Resource Development Advisory Committee
Fort McKay First Nation
Fort McKay Métis Nation
Fort McMurray #468 First Nation
Lakeland Métis Community Association
McMurray Métis
Mikisew Cree First Nation
NON-GOVERNMENT ORGANIZATION MEMBERS
Keyano College
Pembina Institute
GOVERNMENT MEMBERS
Alberta Energy Regulator
Alberta Environment and Parks
Alberta Health
Alberta Health Services
Environment and Climate Change Canada
Health Canada
Parks Canada
Regional Municipality of Wood Buffalo
INDUSTRY MEMBERS
Athabasca Oil Corporation
Canadian Natural
Cenovus Energy Inc.
CNOOC International
Connacher Oil and Gas Ltd.
ConocoPhillips Canada
Hammerstone Infrastructure Materials Ltd.
H.J. Baker Sulphur Canada ULC
Husky Oil Operations Ltd.
Imperial Oil Limited
Inter Pipeline Limited
MEG Energy Corp.
Parsons Creek Aggregates
PetroChina Canada Ltd.
Suncor Energy Inc.
Sunshine Oilsands Ltd.
Surmont Energy
Syncrude Canada Ltd.
Teck Resources Ltd.
Titan Tire Reclamation Corporation


 All Stations
 WBEA Boundary
 Continuous Sites
 Forest Health Sites
 Passive Sites
 Meteorology Towers
 Portable Ozone Monitor
 Deposition Sites
 Active Air Sites


